Available as a chart in the Scope panel, Vectorscope presents colour and saturation data measured via the image signal. Its representation allows for accurate evaluation of colour and thus aids workflows where it is challenging to judge the output by eye.
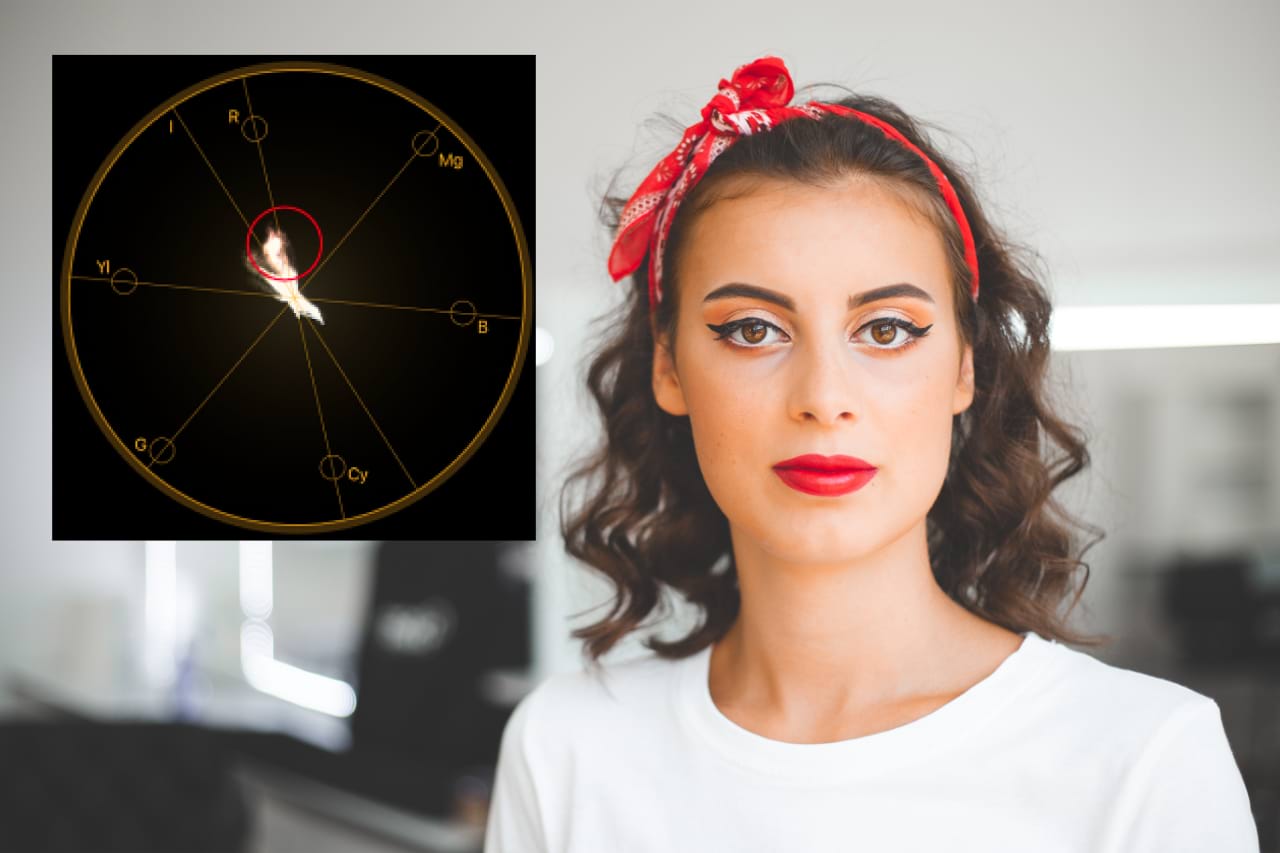
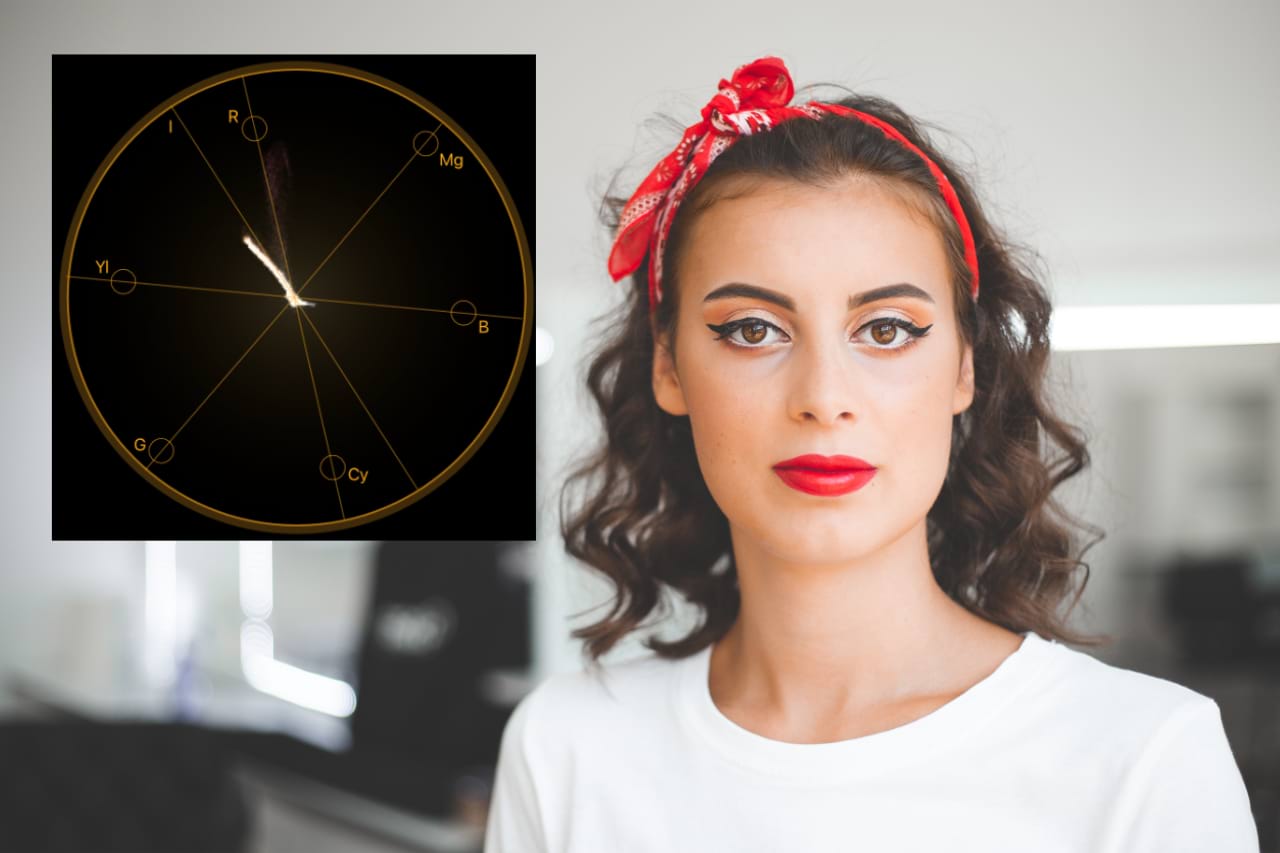
Before and after skin colour correction using Vectorscope as an aid.
About Vectorscope
The Vectorscope pie chart is divided into six parts representing the main colours of the RGB colour space (red, green, blue) as well as their inverse equivalents (cyan, magenta, yellow). The chart places signal information from the image according to where its value sits in relation to the colour space. For example, if there is a significant amount of blue colour in the image, its representation will appear in the region of the blue line.
Additionally, the chart includes the I line, which may be used as an aid during correcting skin tones; the idea here is to adjust skin colours in such a way that their representation sits along this line.
To open the Vectorscope chart:
From the top menu, choose Window>Scope .
In the panel, change the scope type to Vectorscope.
To use Vectorscope as an aid in skin tone correction:
Using the Crop Tool, crop into an area that is visibly inaccurate in the image, e.g. too saturated. Observe the representation of colour on the Vectorscope chart.
Undo the cropping action.
Open the HSL adjustment and, from the dialog, use the Picker to sample colour from the skin area that needs correcting.
Modify the Hue Shift slider to add a positive value (i.e. push it right slightly) while balancing the Saturation Shift with a negative value.
Observe the Vectorscope chart's I line and ensure that the colour representation of the adjustment aligns with it.