Live Luminosity Range Mask
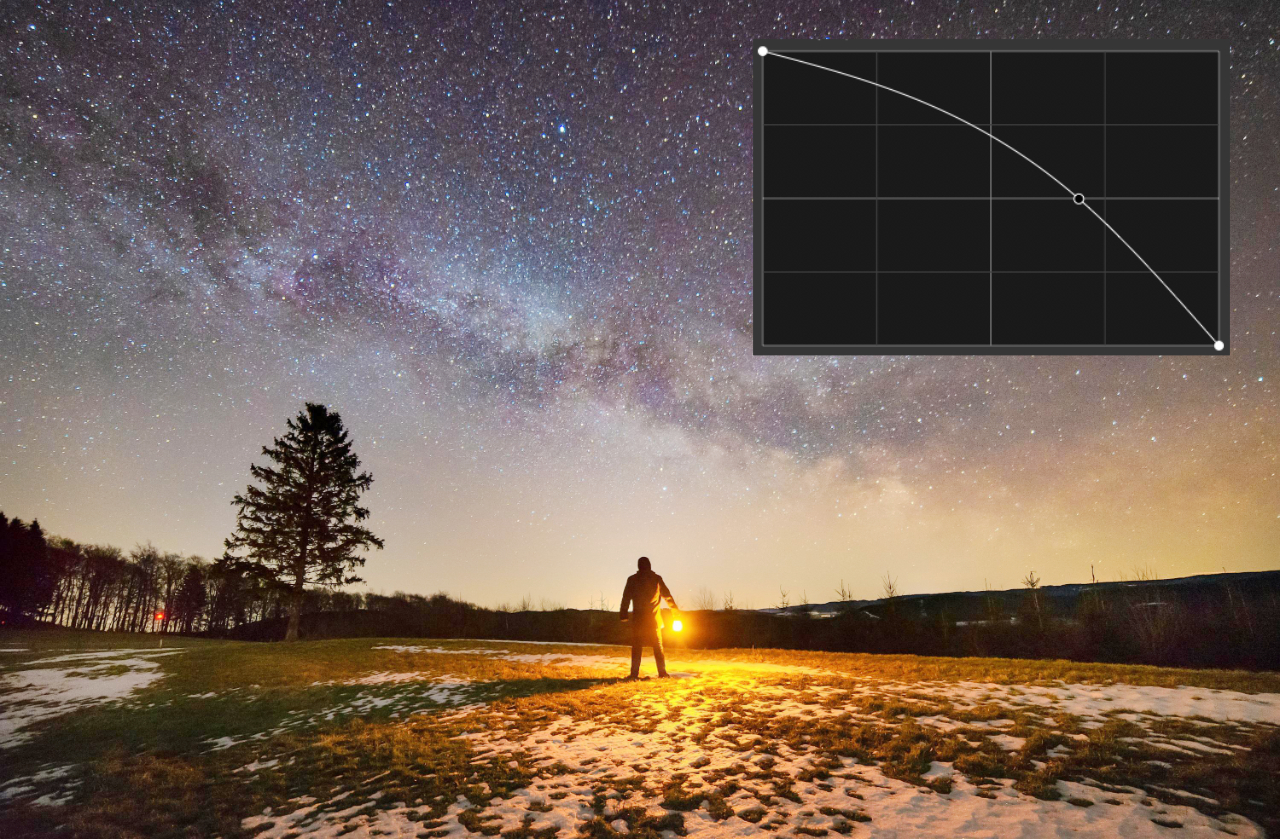
Use non-destructive Luminosity Range Masks to mask an image's tonal range based on its luminosity values. You can isolate specific ranges of shadows or highlights in order to target them with adjustments.


Use non-destructive Luminosity Range Masks to mask an image's tonal range based on its luminosity values. You can isolate specific ranges of shadows or highlights in order to target them with adjustments.


The following settings can be adjusted: